
Understanding
Multi Dimensional Database
Review
Today
Star Schema
Multi Dimensional Database
Review
- Architecture
- Characteristics
- Relational OLAP
- Multidimensional OLAP
- ROLAP VS. MOLAP
Today
Star Schema
- Fact table
- Dimensions
- Drilling Down & Roll up
- Slicing & Dicing
Fact
Definition : Facts are numeric measurements (values) that represent a specific business activity
Facts are stored in a FACT table I.e. the center of the star schema.
Facts are used in business data analysis, are units, cost, prices and revenues
Example: sales figures are numeric measurements that represent product and/or service sales.
Example: sales figures are numeric measurements that represent product and/or service sales.
Fact Table
Central table
- Mostly raw numeric items
- Narrow rows, a few columns at most
- Large number of rows (millions to a billion)
- Access via dimensions
Fact Table
Definition : The centralized table in a star schema is called as FACT table, that contains facts and connected to dimensions. A fact table typically has two types of columns:
- Contain facts and
- Foreign keys to dimension tables.
The primary key of a fact table is usually a composite key that is made up of all of its foreign keys.
A fact table might contain either detail level facts or facts that have been aggregated (fact tables that contain aggregated facts are often instead called summary tables). A fact table usually contains facts with the same level of aggregation.
Dimension
Definition : Qualifying characteristics that provide additional perspective to a given fact..
Example: sales might be compared by product from region to region and from one time period to the next.
Here sales have product, location and time dimensions.
Such dimensions are stored in DIMENSIONAL TABLE.
Such dimensions are stored in DIMENSIONAL TABLE.
Dimension Tables
Definition: The dimensions of the fact table are further described with dimension tables
Fact table:
Sales (Market_id, Product_Id, Time_Id,
Sales_Amt)
Dimension Tables:
Market (Market_Id, City, State, Region)
Product (Product_Id, Name, Category, Price)
Time (Time_Id, Week, Month, Quarter)
Sales (Market_id, Product_Id, Time_Id,
Sales_Amt)
Dimension Tables:
Market (Market_Id, City, State, Region)
Product (Product_Id, Name, Category, Price)
Time (Time_Id, Week, Month, Quarter)
What is Star Schema?
Definition: Star Schema is a relational database schema for representing multidimensional data. It is the simplest form of data warehouse schema that contains one or more dimensions and fact tables.
It is called a star schema because the entity-relationship diagram between dimensions and fact tables resembles a star where one fact table is connected to multiple dimensions.
The center of the star schema consists of a large fact table and it points towards the dimension tables.
The advantage of star schema are slicing down, performance increase and easy understanding of data.
Steps in designing Star Schema
- Identify a business process for analysis(like sales).
- Identify measures or facts (sales dollar).
- Identify dimensions for facts(product dimension, location
- dimension, time dimension, organization dimension).
- List the columns that describe each dimension.(region name,
- branch name, region name).
- Determine the lowest level of summary in a fact table(sales dollar).
- In a star schema every dimension will have a primary key.
- In a star schema, a dimension table will not have any parent table.
- Whereas in a snow flake schema, a dimension table will have one or more parent tables.
- Hierarchies for the dimensions are stored in the dimensional table itself in star schema.
- Whereas hierarchies are broken into separate tables in snow flake schema. These hierarchies helps to drill down the data from topmost hierarchies to the lowermost hierarchies.
Attributes
Each dimension table contain attributes.
Used to search, filter and classify facts.
Example, Sales, we can identify some attributes for each
dimension:
Used to search, filter and classify facts.
Example, Sales, we can identify some attributes for each
dimension:
- Product Dimension: product ID, description, product type
- Location Dimension: region, state, city.
- Time Dimension: year quarter, month, week and date.
Attributes Hierarchy
Definition : AH provides a top-down data organization Used for aggregation and drill-down/roll-up data analysis.
Example, location dimension attributes can be organized in a hierarchy by region, state and city.
AH provides the capability to perform drill-down and roll-up searches.
Allows the DW and OLAP systems to to have defined path.
Example, location dimension attributes can be organized in a hierarchy by region, state and city.
AH provides the capability to perform drill-down and roll-up searches.
Allows the DW and OLAP systems to to have defined path.
A Concept Hierarchy: Dimension (location)

A Concept Hierarchy: Dimension (location)


Multidimensional Data

A Sample Data Cube

A Sample Data Cube

Star Schema
A single fact table and for each dimens one dimension tableDoes not capture hierarchies directly


In the example, sales fact table is connected to dimensions location, product, time and organization. It shows that data can be sliced across all dimensions and again it is possible for the data to be aggregated across multiple dimensions. "Sales dollar" in sales fact table can be calculated across all dimensions independently or in a combined manner which is explained below.
- Sales dollar value for a particular product
- Sales dollar value for a product in a location
- Sales dollar value for a product in a year within a location
- Sales dollar value for a product in a year within a location sold or serviced by an employee
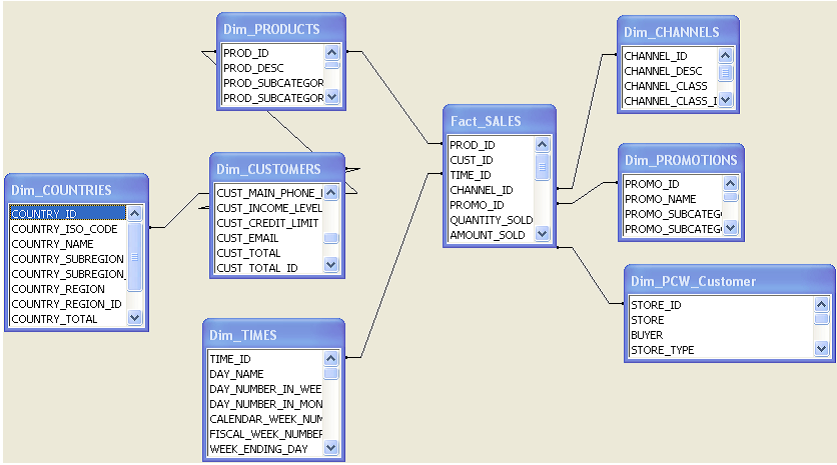
Example of Star Schema

Aggregation
Many OLAP queries involve aggregation of the data in the fact table
For example, to find the total sales (over time) of each product in each market, we might use
SELECT S.Market_Id, S.Product_Id, SUM
(S.Sales_Amt)
FROM Sales S
GROUP BY S.Market_Id, S.Product_Id
SELECT S.Market_Id, S.Product_Id, SUM
(S.Sales_Amt)
FROM Sales S
GROUP BY S.Market_Id, S.Product_Id
The aggregation is over the entire time dimension and thus produces a two-dimensional view of the data
Aggregation Over Time
The output of the previous query

Typical OLAP
Operations
Operations
Roll up (drill-up): summarize data
- by climbing up hierarchy or by dimension reduction
Drill down (roll down): reverse of roll-up
- from higher level summary to lower level summary or detailed data, or introducing new dimensions
Slice and dice:
- project and select
Pivot (rotate):
1. SELECT S.Product_Id, M.State, SUM
(S.Sales_Amt)
FROM Sales S, Market M
WHERE M.Market_Id = S.Market_Id
GROUP BY S.Product_Id, M.State
then we can roll up from there to:
2. SELECT T.Product_Id, M.Region, SUM
(T.Sales_Amt)
FROM State_Sales T, Market M
WHERE M.State = T.State
GROUP BY T.Product_Id, M.Region
- reorient the cube, visualization, 3D to series of 2D planes.
- drill across: involving (across) more than one fact table
- drill through: through the bottom level of the cube to its back-end relational tables (using SQL)
Drilling Down and Rolling Up
Some dimension tables form an aggregation hierarchy
Market_Id → City → State → Region
Executing a series of queries that moves down a hierarchy (e.g., from aggregation over regions to that over states) is called drilling down
Market_Id → City → State → Region
Executing a series of queries that moves down a hierarchy (e.g., from aggregation over regions to that over states) is called drilling down
- Requires the use of the fact table or information more specific than the requested aggregation (e.g., cities)
Drilling Down
Drilling down on market: from Region to State
Sales (Market_Id, Product_Id, Time_Id, Sales_Amt)
Market (Market_Id, City, State, Region)
Sales (Market_Id, Product_Id, Time_Id, Sales_Amt)
Market (Market_Id, City, State, Region)
SELECT S.Product_Id, M.Region, SUM (S.Sales_Amt)
FROM Sales S, Market M
WHERE M.Market_Id = S.Market_Id
GROUP BY S.Product_Id, M.Region
SELECT S.Product_Id, M.State, SUM (S.Sales_Amt)
FROM Sales S, Market M
WHERE M.Market_Id = S.Market_Id
GROUP BY S.Product_Id, M.State,
FROM Sales S, Market M
WHERE M.Market_Id = S.Market_Id
GROUP BY S.Product_Id, M.Region
SELECT S.Product_Id, M.State, SUM (S.Sales_Amt)
FROM Sales S, Market M
WHERE M.Market_Id = S.Market_Id
GROUP BY S.Product_Id, M.State,
Rolling Up
Rolling up on market, from State to Region
- If we have already created a table, State_Sales, using
(S.Sales_Amt)
FROM Sales S, Market M
WHERE M.Market_Id = S.Market_Id
GROUP BY S.Product_Id, M.State
then we can roll up from there to:
2. SELECT T.Product_Id, M.Region, SUM
(T.Sales_Amt)
FROM State_Sales T, Market M
WHERE M.State = T.State
GROUP BY T.Product_Id, M.Region
Roll-up and Drill Down

“Slicing and Dicing”

Snowflake Schema
A snowflake schema is a term that describes a star schema structure normalized through the use of outrigger tables. i.e dimension table hierarchies are broken into simpler tables. In star schema example we had 4 dimensions like location, product, time, organization and a fact table (sales)
A snowflake schema is a term that describes a star schema structure normalized through the use of outrigger tables. i.e dimension table hierarchies are broken into simpler tables. In star schema example we had 4 dimensions like location, product, time, organization and a fact table (sales)
Snowflake schema
Represent dimensional hierarchy directly by normalizing tables.
Easy to maintain and saves storage
Easy to maintain and saves storage
Example of Snowflake Schema

Example of Snowflake Schema

No comments:
Post a Comment