
Hyperion Essbase
Working with Spread sheet Add-in
Working with Spread sheet Add-in
The beauty of Essbase exists in great multidimensional data analytical features for business users. The users can play around with data features remaining in excel offer by using Essbase Spread Sheet Client. Business users can play around with data remaining in excel. Indeed excel being the favorite tools for data analyst. In fact Essbase itself is Extended Spread Sheet Database. In today’s topic we’ll explore some good features of Essbase client.
Essbase Spreadsheet Add-in is a software program that merges seamlessly with Microsoft Excel. After Essbase is installed, a special menu is added to the spreadsheet application. The menu provides enhanced commands such as Connect, Pivot, Drill-down, and Calculate. Users can
access and analyze data on Essbase Server by using simple mouse clicks and drag-and-drop operations. Spreadsheet Add-in enables multiple users to access and to update data on EssbaseServer simultaneously.
access and analyze data on Essbase Server by using simple mouse clicks and drag-and-drop operations. Spreadsheet Add-in enables multiple users to access and to update data on EssbaseServer simultaneously.
Once you install Essbase Client, you find the Essbase menu appears in Excel with other menus.

Once you connect to the Essbase server, the next step is to retrieve the data from the cube.
Select Essbase->Retrieve

Users can now retrieve the account details of the specific account and entity without learning a new user interface. Essbase client provides many options to analyze the data.
For example in Sample Basic application you need to retrieve the Actual Sales information for New York Entity for Qtr1 for all products of product category 100.
For example in Sample Basic application you need to retrieve the Actual Sales information for New York Entity for Qtr1 for all products of product category 100.
So we need Data
Account = Sales
Market = “New York”
Scenario = Actual
Product = Children of 100
Time = Children of Qtr1.
Account = Sales
Market = “New York”
Scenario = Actual
Product = Children of 100
Time = Children of Qtr1.
We can drill down/up to view the specific member of the cell. Essbase->Zoom In to drill down to the next level or Zoom Out for drill up. The default behavior is drill down to next level however; you can modify the default behaviors. Alternatively you can left button double click to retrieve the data at next level or right double click to drill up. Essbase client also facilitates you to focus on particular Dimension member. Essbase->Keep Only to focus on specific member or Essbase->Remove only to remove the specific member from the list.
In this document we are discussing some important options of Essbase.
Essbase->Options
Essbase->Options
There are five tabs in Essbase Options:
I. Display Tab
II. Zoom Tab
III. Mode Tab
IV. Style Tab
V. Global Tab
I. Display Tab
II. Zoom Tab
III. Mode Tab
IV. Style Tab
V. Global Tab

I. Display Tab:
Within the Display Tab you have the following sections: .
Within the Display Tab you have the following sections: .
- Indentation – indents subitems and totals.
- Replacement – Replace a “None Value” with any chosen name.
- Suppress – Suppresses Missing Rows, Zero Rows, and Underscore Characters.
- Aliases – Selections:
- No selection – Essbase will give you only the Account for the project.
- Use Aliases – Essbase gives you the Member Alias Name in the same cell.
- Use Both Member Names and Aliases for Row Dimensions - gives you the Account ID in one cell and the Account Name and the Market Name in another cell.
- Cells – Selections:
- Use Styles – Will enable you to use the “Style Tab”.
- Adjust Columns – Will automatically adjust the column width when you retrieve data.
- Advanced Options
- Query Designer
- Dynamic Time Series
Note: You can not select these options if you select “Formula Preservation” on the Mode Tab.
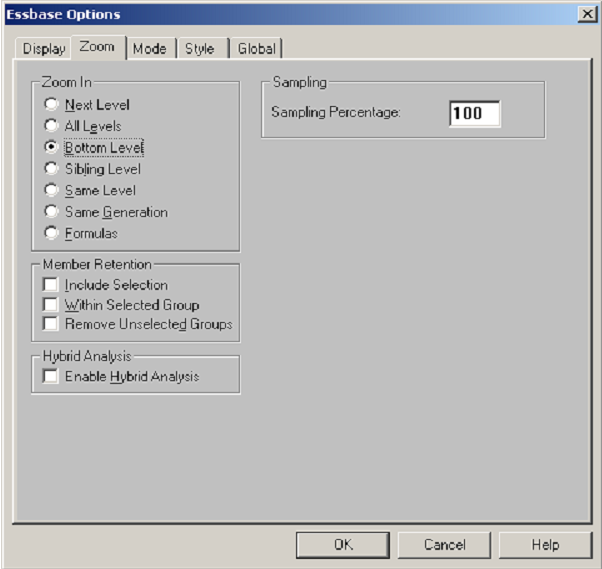
II. Zoom Tab:
Within the Zoom Tab you have the following sections:
Within the Zoom Tab you have the following sections:
Zoom In :
- Next Level: Displays the next level down of detail
- All Levels: Shows All members (parents and children) of the selected dimension
- Bottom Level: Shows the lowest level of detail only (children only)
- Sibling Level: Displays all siblings of the current member
- Same Level: Displays all members from the same level
- Same Generation: Displays all member from the same generation
- Formulas: Displays the members that make up the selected member value.
• Member Retention –
- Include Selection: Includes the original selection. Example: If you drill down on MArket to the individual Market, the report will give you all of the States within Market along with the segment “States” results.
- Within Selected Group – Will give you all of the projects within that “Selected Group”.
Advanced Features/Options:
- Remove Unselected Groups
- Enable Hybrid Analysis
- Sampling Percentage

Mode Tab – Advanced Options.
The Essbase Add-In will automatically overwrite cells when you drill down or retrieve new data unless you specify that it should retain “Formula Preservation.”
You can enable this feature by selecting it in the “Mode” tab of the “Essbase Options” dialog box.
You can enable this feature by selecting it in the “Mode” tab of the “Essbase Options” dialog box.
Note: If you choose “Formula Preservation” you can not also select “Suppress Missing Rows” or “Suppress Zero Rows” on the the Display Tab.

IV. Style Tab – The style tab is used to format your report.
Choose either “Member”, “Dimensions” or “Data Cell” and click on “Format”.
At this point you can format the Font of that particular “Member”, “Dimension” or “Data Cell”.
Choose either “Member”, “Dimensions” or “Data Cell” and click on “Format”.
At this point you can format the Font of that particular “Member”, “Dimension” or “Data Cell”.

V. Global Tab – Used to give you multiple functionalities.
• Mouse Actions - You can enable how you want your mouse to be used.
- Enable Secondary Button – Allows the user to cancel a “Drill Down” function on a dimension by double-clicking on the right side of the mouse.
- Enable Double-Clicking – Allows the user to “Drill Down” on a dimension by double-clicking on the left side of the mouse.
Note: Using “Enable Secondary Button” disables the “normal” Excel use of the right side clicking of the mouse.
- Memory - You can enable/disable the “Flashback” option. Recommended: ”Enable Flashback”.
- Display Messages - Gives you the ability to choose how you want your messages within the tool displayed. Recommended: “Display Warnings”.
Advanced Features/Options:
- Limit to Connected Sheets
- Log File
- Add-Ins
- Member Select
- Mode
No comments:
Post a Comment